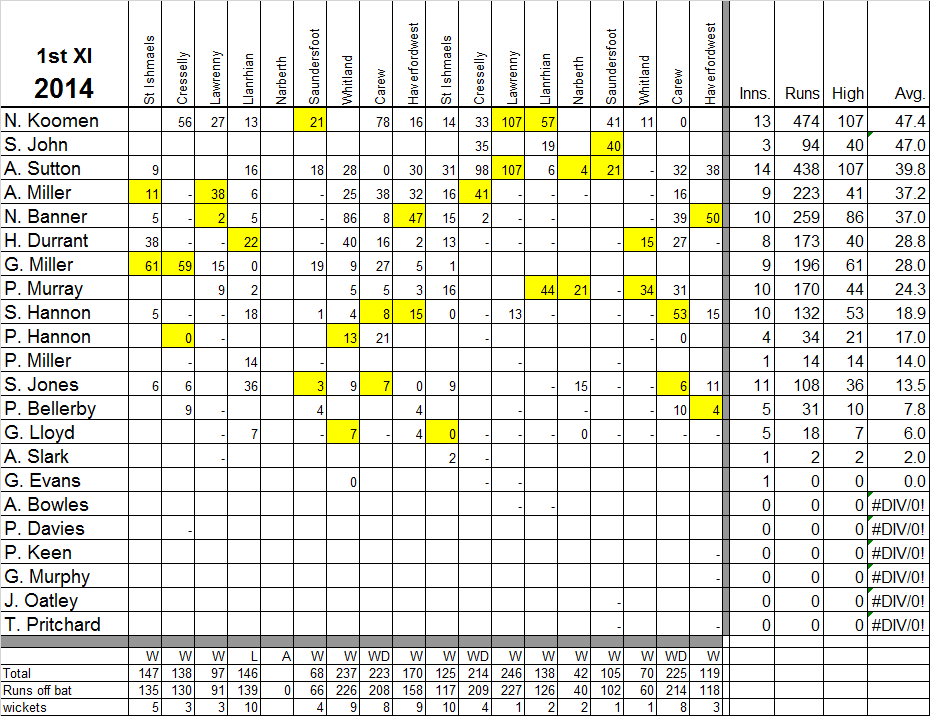
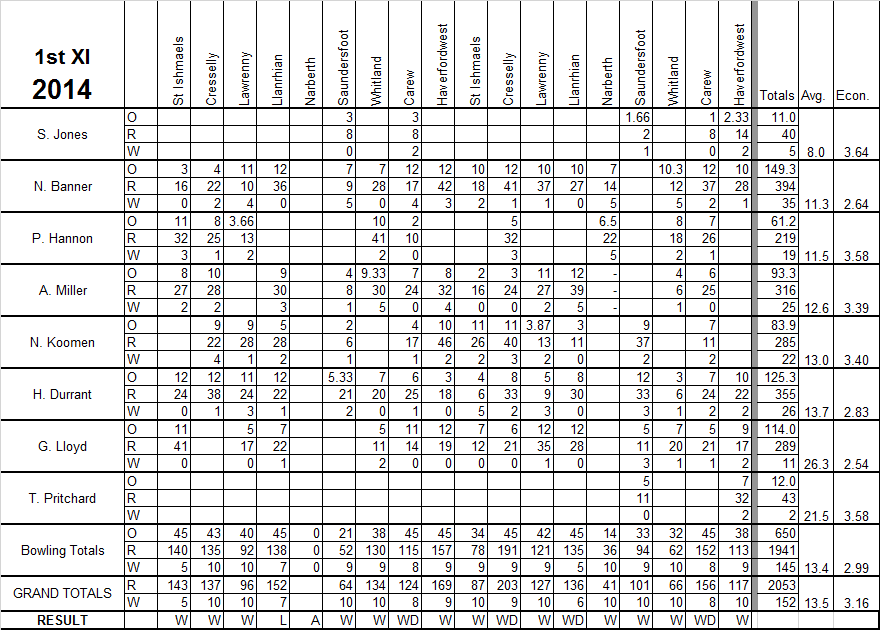
Neyland Cricket Club 1st XI Averages, 2014.
Batting Averages| Name | Matches | Innings | Total runs | High Score | Not out | Average |
| Nicholas Koomen | 13 | 13 | 474 | 107no | 3 | 47.4 |
| Scott John | 3 | 3 | 94 | 40no | 1 | 47.0 |
| Ashley Sutton | 15 | 14 | 438 | 107no | 4 | 39.8 |
| Andrew Miller | 15 | 9 | 223 | 41no | 3 | 37.2 |
| Nathan Banner | 15 | 10 | 259 | 86 | 3 | 37.0 |
| Henry Durrant | 16 | 8 | 173 | 40 | 2 | 28.8 |
| Gregg Miller | 9 | 9 | 196 | 61no | 2 | 28.0 |
| Paul Murray | 11 | 10 | 170 | 44no | 3 | 24.3 |
| Sean Hannon | 16 | 10 | 132 | 53no | 3 | 18.9 |
| Patrick Hannon | 7 | 4 | 34 | 21 | 2 | 17.0 |
| Paul Miller | 5 | 1 | 14 | 14 | 0 | 14.0 |
| Scott Jones | 14 | 11 | 108 | 36 | 3 | 13.5 |
| Patrick Bellerby | 9 | 4 | 31 | 10 | 1 | 7.8 |
| Gary Lloyd | 15 | 5 | 18 | 7no | 2 | 6.0 |
| Andrew Slark | 3 | 1 | 2 | 2 | 0 | 2.0 |
| G Evans | 3 | 1 | 0 | 0 | 0 | 0.0 |
| A Bowles | 2 | 0 | - | - | - | -.- |
| T Pritchard | 2 | 0 | - | - | - | -.- |
| Phil Davies | 1 | 0 | - | - | - | -.- |
| Phil Keen | 1 | 0 | - | - | - | -.- |
| G Murphy | 1 | 0 | - | - | - | -.- |
| Jason Oatley | 1 | 0 | - | - | - | -.- |

Bowling Averages
| Name | Matches | Overs | Runs | Wickets | Economy | Average |
| Scott Jones | 14 | 11.0 | 40 | 5 | 3.64 | 8.0 |
| Nathan Banner | 16 | 149.2 | 394 | 35 | 2.64 | 11.3 |
| Patrick Hannon | 7 | 61.1 | 219 | 19 | 3.58 | 11.5 |
| Andrew Miller | 15 | 93.2 | 316 | 25 | 3.39 | 12.6 |
| Nicholas Koomen | 13 | 83.5 | 285 | 22 | 3.40 | 13.0 |
| Henry Durrant | 16 | 125.2 | 355 | 26 | 2.83 | 13.7 |
| Gary Lloyd | 15 | 114.0 | 289 | 11 | 2.54 | 26.3 |
| Tom Pritchard | 2 | 12.0 | 43 | 2 | 3.58 | 21.5 |

As usual, the above averages are based on league matches only.
Final league table, 2014
Fixtures & Results, 2014