Neyland Cricket Club 1st XI Averages, 2004.
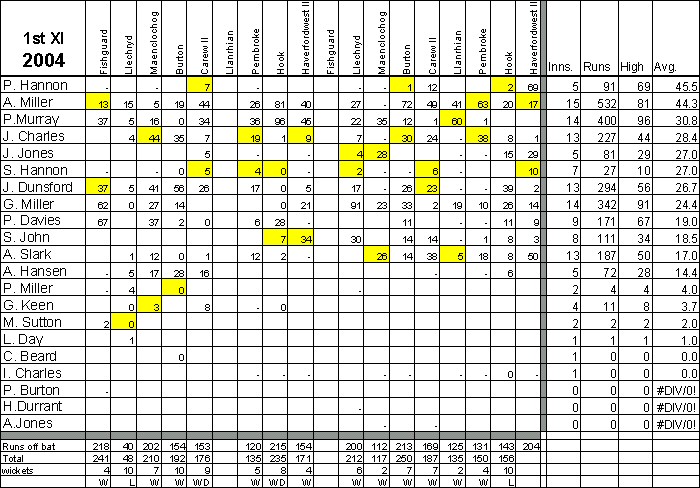
Batting Averages| Name | Matches | Innings | Total runs | High Score | Not out | Average |
| Patrick Hannon | 10 | 5 | 91 | 69 | 3 | 45.5 |
| Andrew Miller | 16 | 15 | 532 | 81 | 3 | 44.3 |
| Paul Murray | 14 | 14 | 400 | 96 | 1 | 30.8 |
| Jeremy Charles | 15 | 13 | 227 | 44no | 5 | 28.5 |
| John Jones | 9 | 5 | 81 | 29 | 2 | 27.0 |
| Sean Hannon | 13 | 7 | 27 | 10no | 6 | 27.0 |
| Jay Dunsford | 16 | 13 | 294 | 56 | 2 | 26.7 |
| Gregg Miller | 14 | 14 | 342 | 91 | 0 | 24.4 |
| Phillip Davies | 12 | 9 | 171 | 67 | 0 | 19.0 |
| Scott John | 9 | 8 | 111 | 34no | 2 | 18.5 |
| Andrew Slark | 14 | 13 | 187 | 50 | 2 | 17.0 |
| Andrew Hansen | 8 | 5 | 72 | 28 | 0 | 14.4 |
| Paul Miller | 4 | 2 | 4 | 4 | 1 | 4.0 |
| Graham Keen | 5 | 4 | 11 | 8 | 1 | 3.7 |
| Mark Sutton | 2 | 2 | 2 | 2 | 1 | 2.0 |
| Lee Day | 1 | 1 | 1 | 1 | 0 | 1.0 |
| Chris Beard | 1 | 1 | 0 | 0 | 0 | 0.0 |
| Ian Charles | 9 | 1 | 0 | 0 | 0 | 0.0 |
| Peter Burton | 1 | 0 | - | - | - | - |
| Henry Durrant | 1 | 0 | - | - | - | - |
| Andrew Jones | 2 | 0 | - | - | - | - |
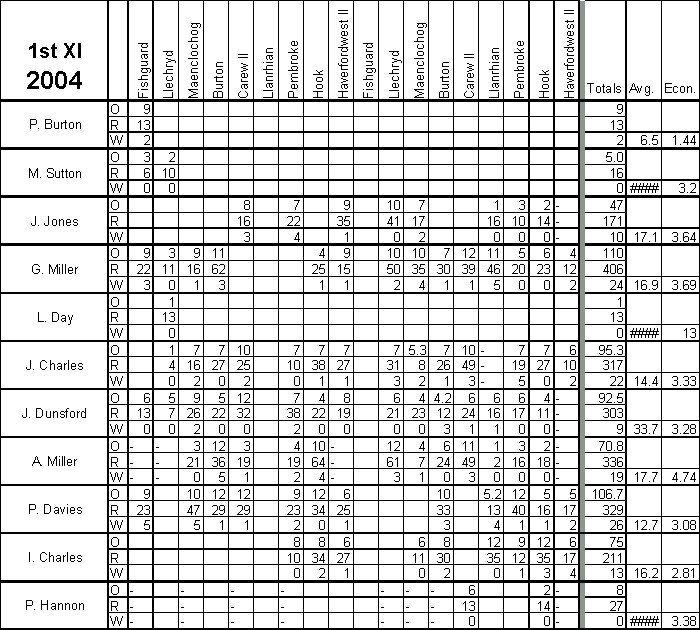
Bowling Averages
| Name | Matches | Overs | Runs | Wickets | Economy | Average |
| Peter Burton | 1 | 9 | 13 | 2 | 1.44 | 6.5 |
| Phillip Davies | 12 | 106.4 | 329 | 26 | 3.08 | 12.7 |
| Jeremy Charles | 15 | 95.2 | 317 | 22 | 3.33 | 14.4 |
| Ian Charles | 9 | 75 | 211 | 13 | 2.81 | 16.2 |
| Gregg Miller | 14 | 110 | 406 | 24 | 3.69 | 16.9 |
| John Jones | 9 | 47 | 171 | 10 | 3.64 | 17.1 |
| Andrew Miller | 15 | 70.8 | 336 | 19 | 4.74 | 17.7 |
| Jay Dunsford | 16 | 92.5 | 303 | 9 | 3.28 | 33.7 |
| Mark Sutton | 2 | 5 | 16 | 0 | 3.20 | - |
| Patrick Hannon | 10 | 8 | 27 | 0 | 3.38 | - |
| Lee Day | 1 | 1 | 13 | 0 | 13.0 | - |
Final league table, 2004
Fixtures & Results, 2004