Neyland Cricket Club 1st XI Averages, 2003.
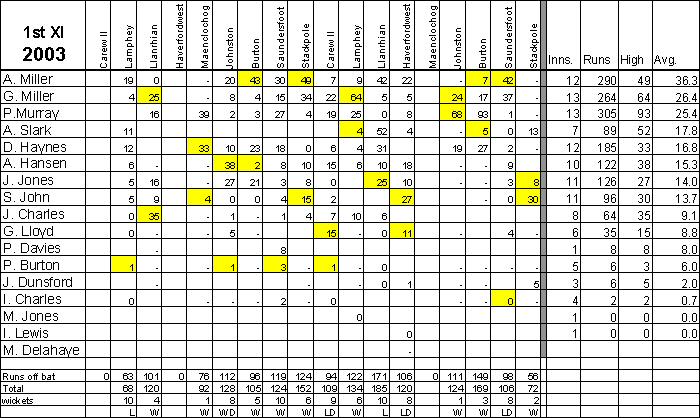
Batting Averages| Name | Matches | Innings | Total runs | High Score | Not out | Average |
| Andrew Miller | 15 | 12 | 290 | 49no | 4 | 36.3 |
| Gregg Miller | 15 | 13 | 264 | 64no | 3 | 26.4 |
| Paul Murray | 14 | 13 | 305 | 93 | 1 | 25.4 |
| Andrew Slark | 8 | 7 | 89 | 52 | 2 | 17.8 |
| David Haynes | 13 | 12 | 185 | 33no | 1 | 16.8 |
| Andrew Hansen | 14 | 10 | 122 | 38no | 2 | 15.3 |
| John Jones | 14 | 11 | 126 | 27 | 2 | 14.0 |
| Scott John | 12 | 11 | 96 | 30no | 4 | 13.7 |
| Jeremy Charles | 10 | 8 | 64 | 35no | 1 | 9.1 |
| Gary Lloyd | 12 | 6 | 35 | 15no | 2 | 8.8 |
| Phillip Davies | 2 | 1 | 8 | 8 | 0 | 8.0 |
| Peter Burton | 14 | 5 | 6 | 3no | 4 | 6.0 |
| Jay Dunsford | 8 | 3 | 6 | 5 | 0 | 2.0 |
| Ian Charles | 11 | 4 | 2 | 2 | 1 | 0.7 |
| Martin Jones | 1 | 1 | 0 | 0 | 0 | 0.0 |
| Ian Lewis | 1 | 1 | 0 | 0 | 0 | 0.0 |
| Michael Delahaye | 1 | 0 | - | - | - | - |
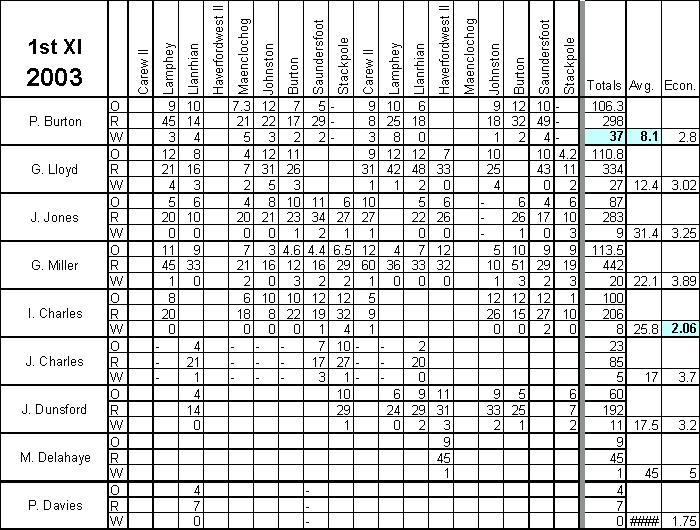
Bowling Averages
| Name | Matches | Overs | Runs | Wickets | Economy | Average |
| Peter Burton | 14 | 106.3 | 298 | 37 | 2.80 | 8.1 |
| Gary Lloyd | 12 | 110.2 | 334 | 27 | 3.02 | 12.4 |
| Jeremy Charles | 10 | 23 | 85 | 5 | 3.70 | 17.0 |
| Jay Dunsford | 8 | 60 | 192 | 11 | 3.20 | 17.5 |
| Gregg Miller | 15 | 113.5 | 442 | 20 | 3.89 | 22.1 |
| Ian Charles | 11 | 100 | 206 | 8 | 2.06 | 25.8 |
| John Jones | 14 | 87 | 283 | 9 | 3.25 | 31.4 |
| Michael Delahaye | 1 | 9 | 45 | 1 | 5.00 | 45.0 |
| Phillip Davies | 2 | 4 | 7 | 0 | 1.75 | - |
| Andrew Miller | 15 | 1 | 10 | 0 | 10.00 | - |
Final league table, 2003
Fixtures & Results, 2003